data visualizations
HOW MUCH DATA ARE YOU ACTUALLY SEEING?
Simple yet powerful visualizations
Our dashboards, sensor trend graphic, alarm parameters and asset data help you see and understand your assets health and performance.
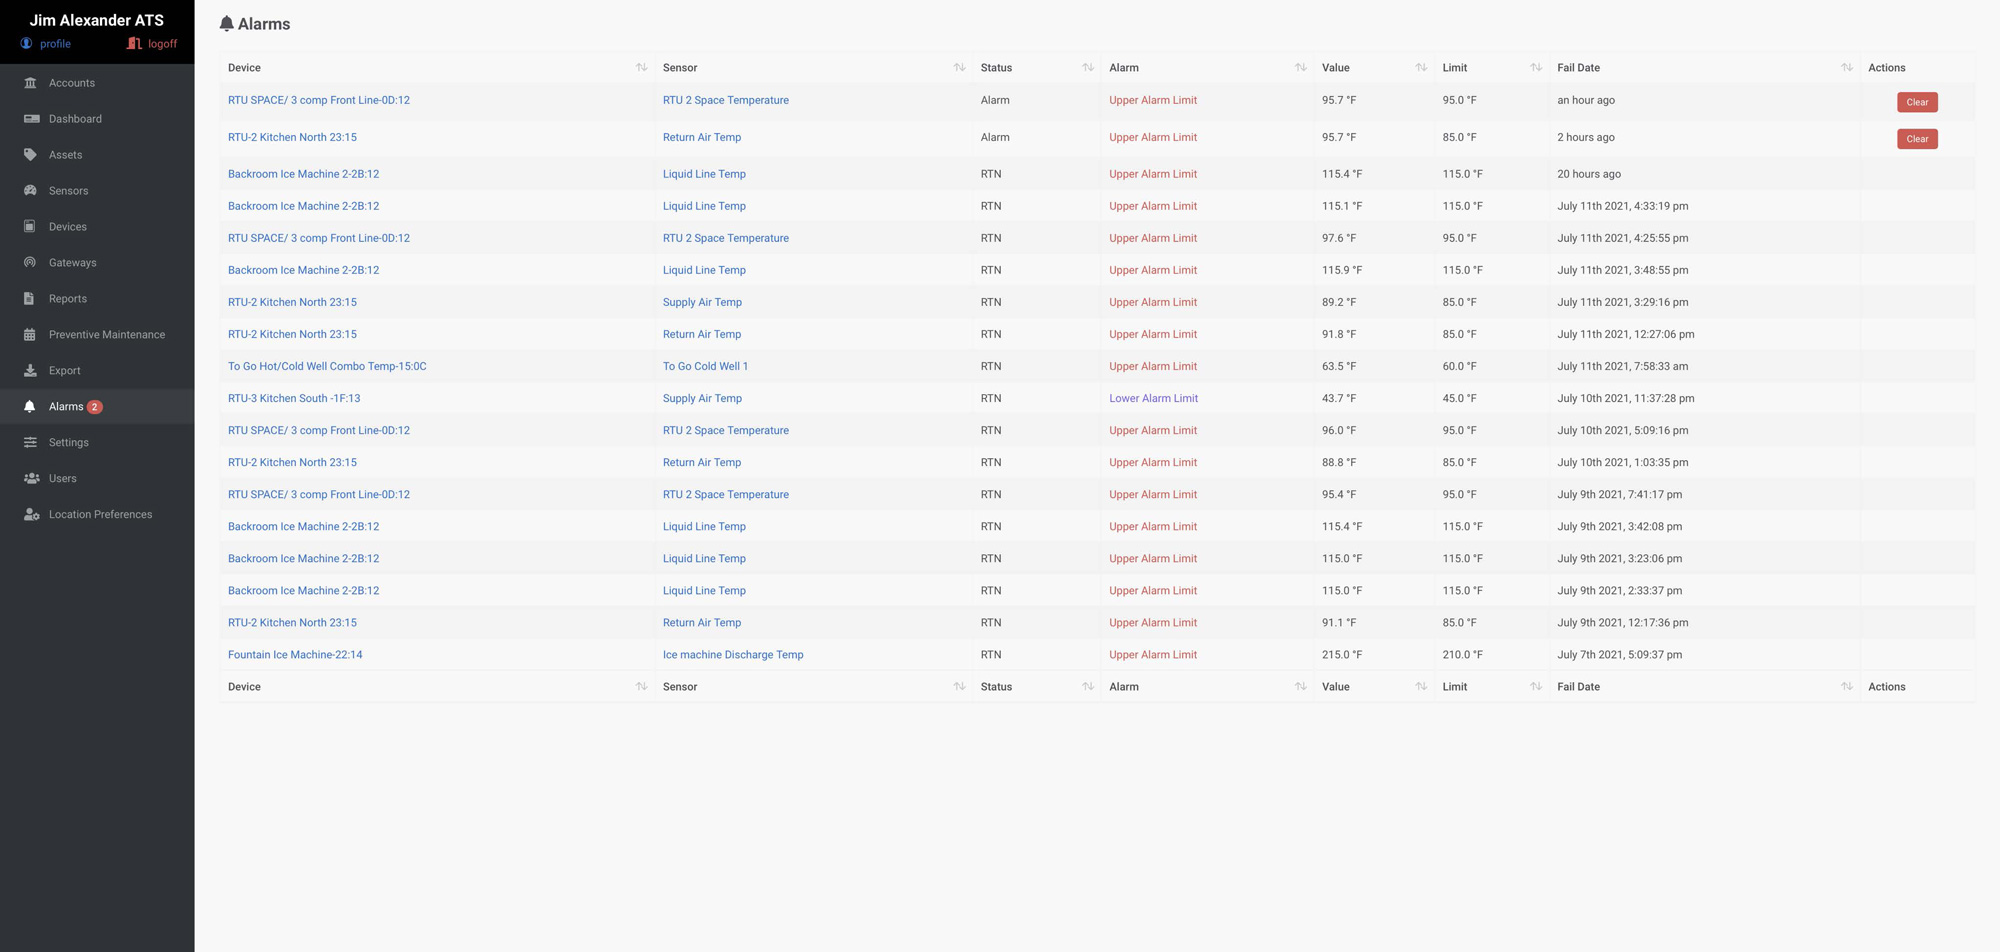
Alarm Logging

Live Interactive Location Dashboard

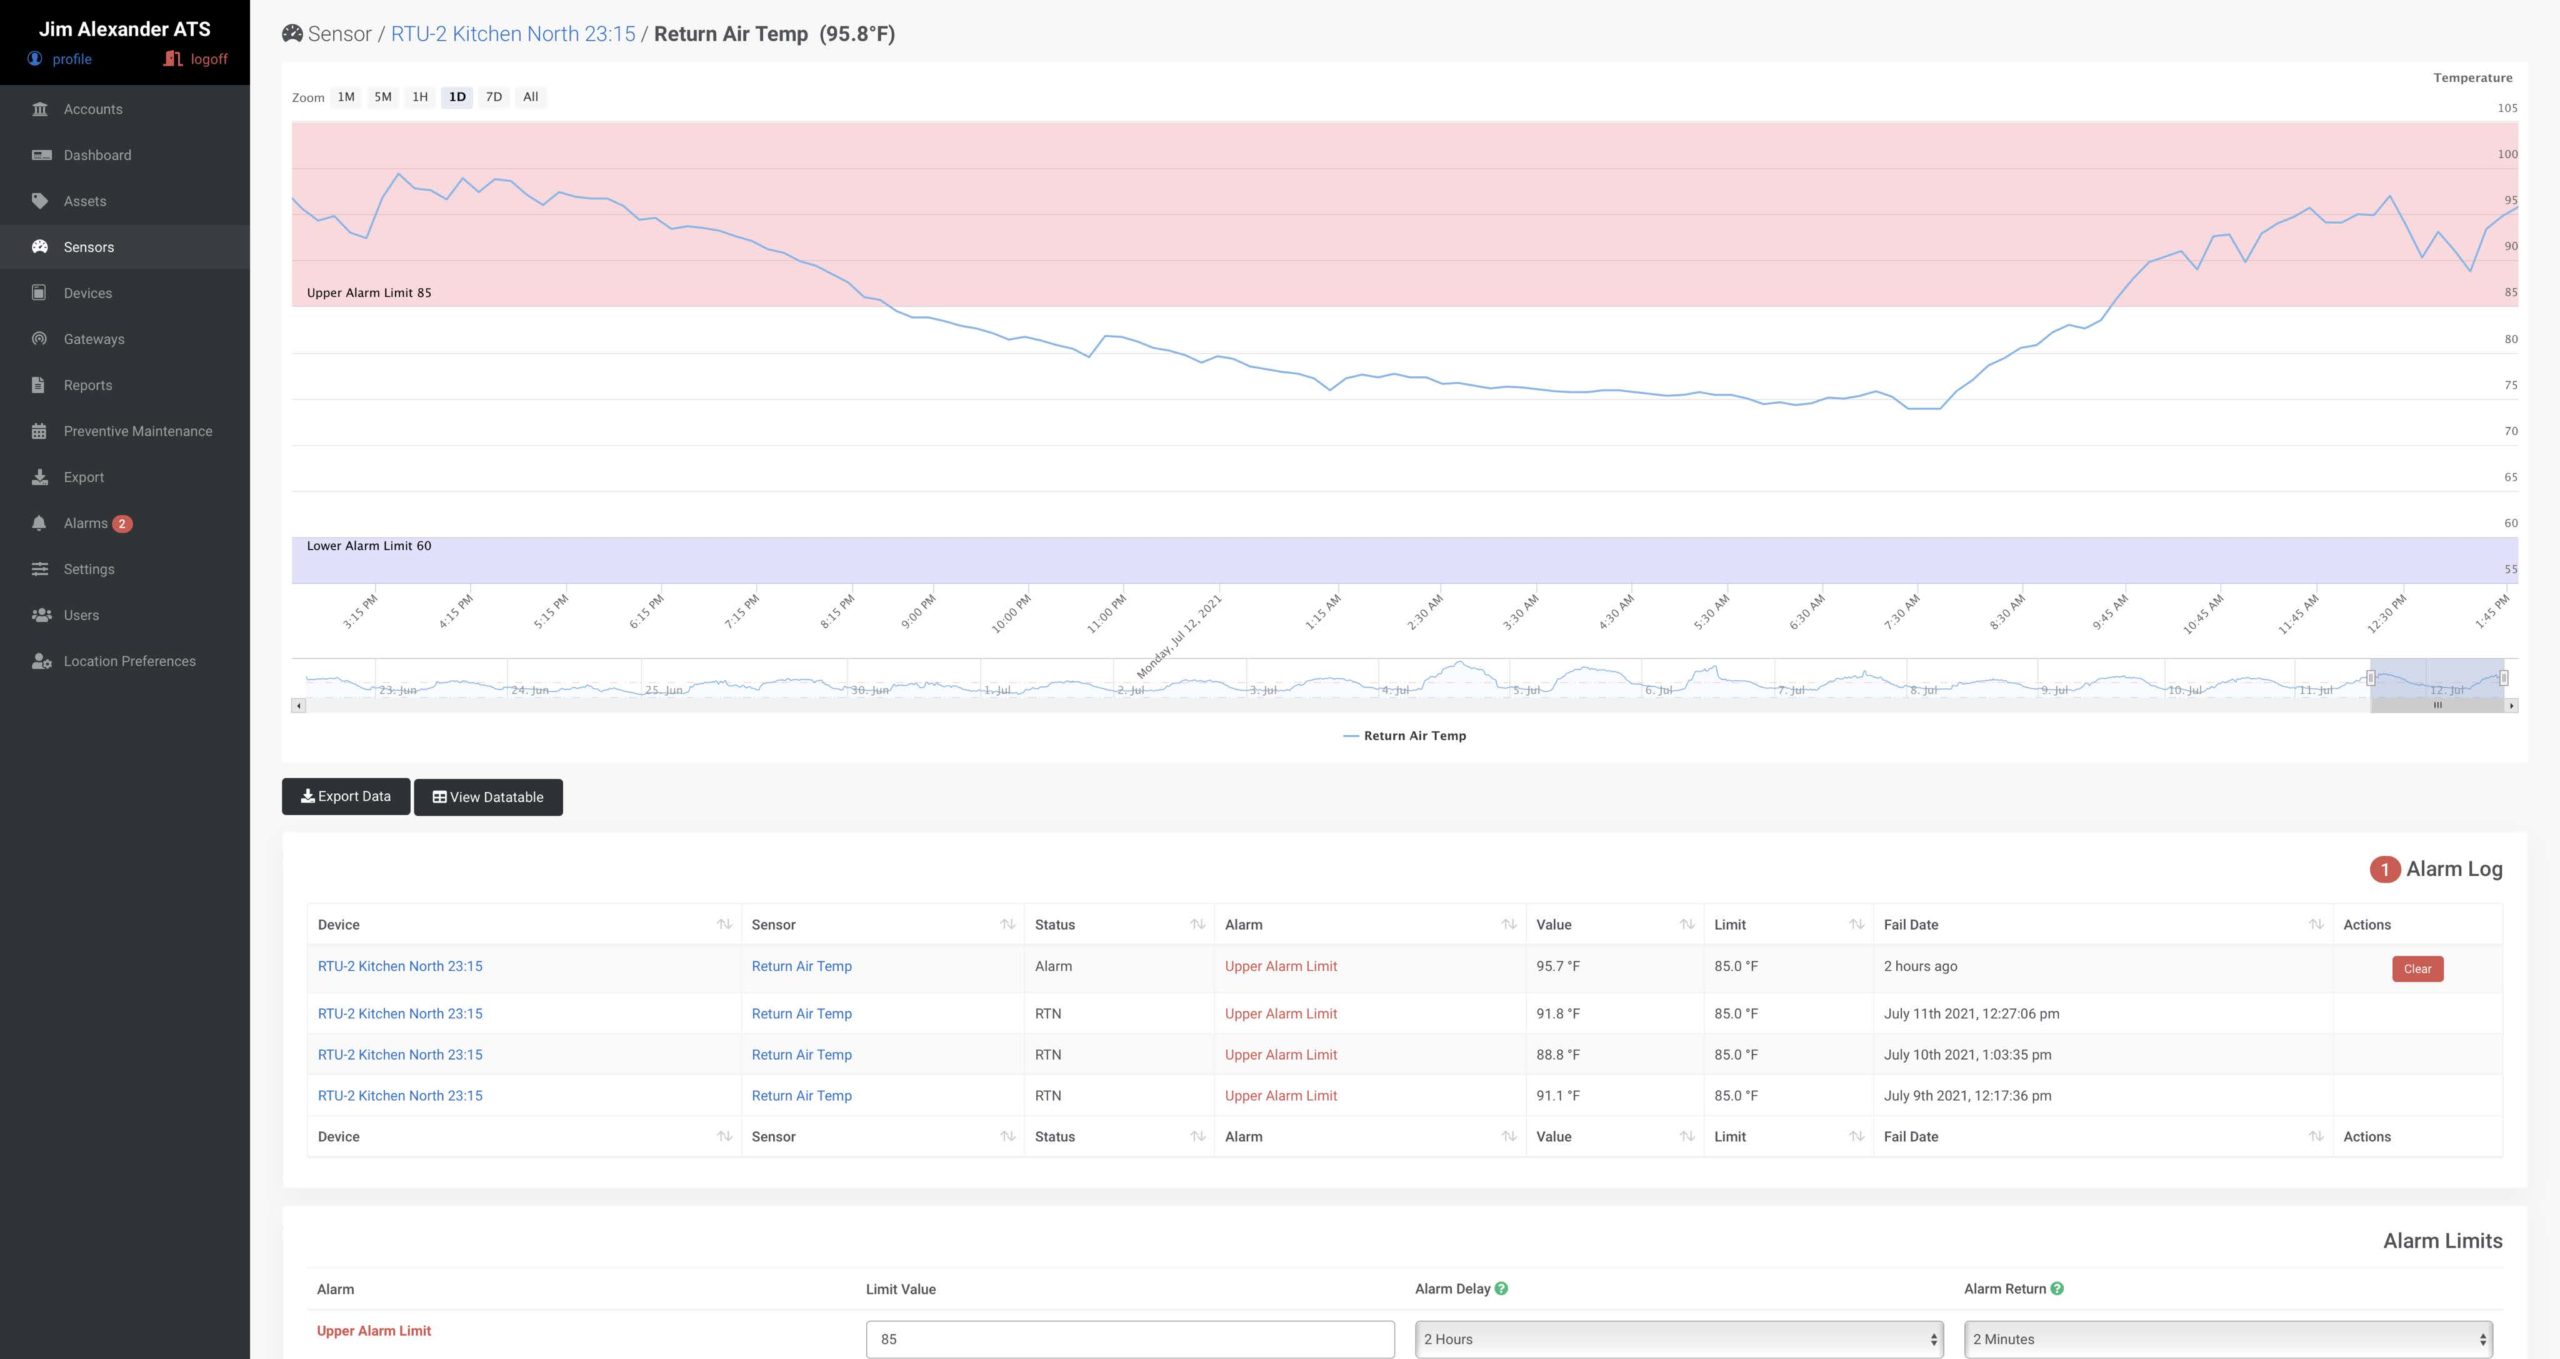
Asset Trend Graphing

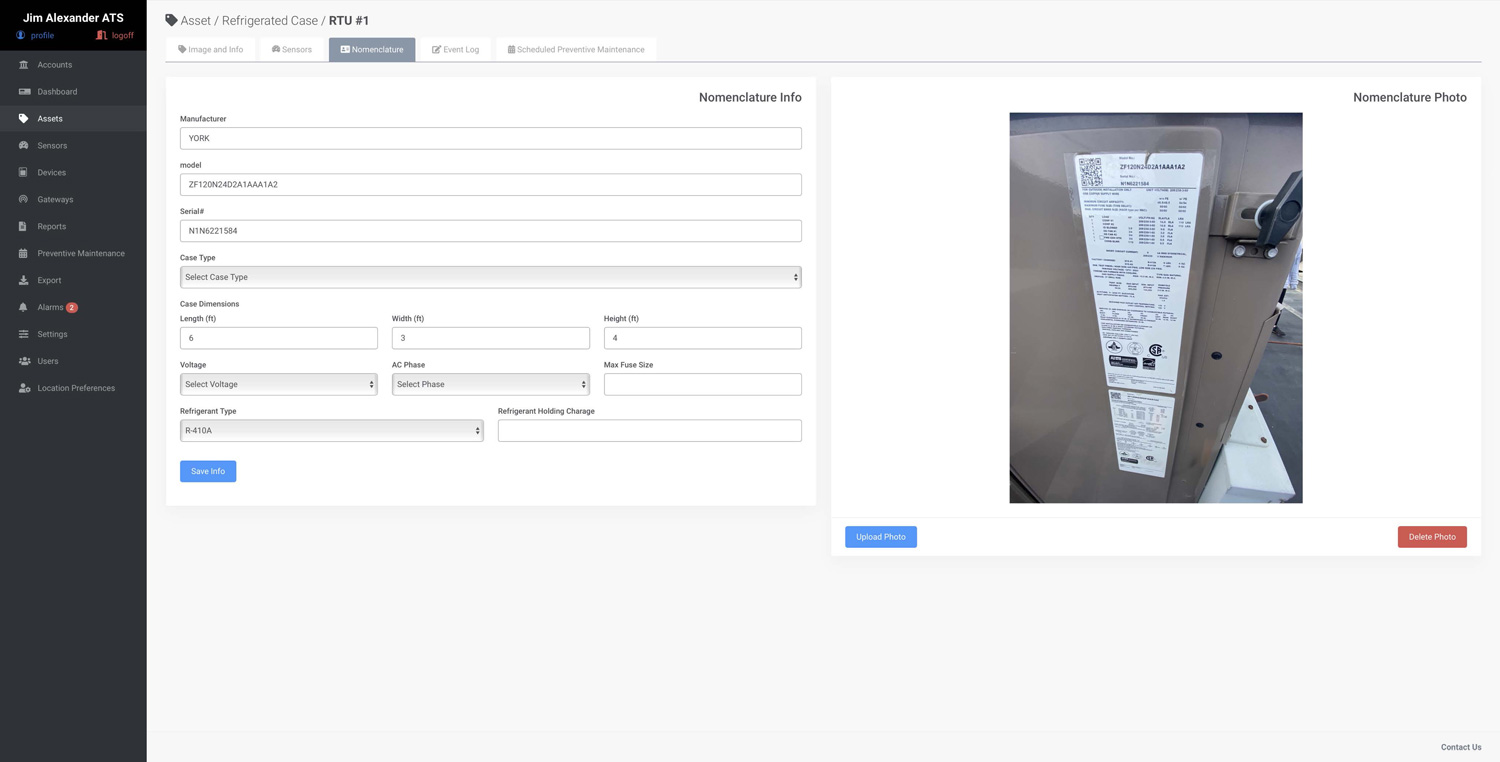
Asset Nomenclature

